The end of March 2021 marks the one-year anniversary of the stock market bottom and the end of the shortest bear market on record. Since then the U.S. stock markets have quickly reached new highs, with the Dow Jones Industrial Average (DJIA) briefly crossing 33,000 last week.
During the past year, investors witnessed the mega-cap DJIA, the large-cap S&P 500, the tech-laden NASDAQ and the smaller-cap Russell 2000 rise sharply as expectations of improving fundamentals took hold. But as we now enter the second year, with expectations that the economy might deliver rapid growth (from pandemic-induced depressed levels) that aim to catch up with the rising stock markets, how are you positioned?
Asked more directly: were you fully invested from the stock market bottom or did you try to time the ups and downs of the market over the past year?
If you tried to time the market, the likelihood of you doing it well is not very high.
Trying to Time the Market
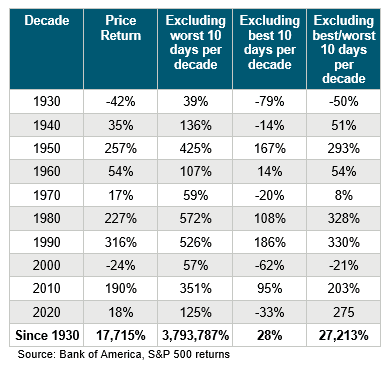
Bank of America recently put real numbers into quantifying just how much money investors might lose (or not gain) by trying to time the ups and downs of the market.
Examining almost 100 years of data (going back to 1930), Bank of America found that if an investor missed the S&P 500′s 10 best days each decade, the total return would have been 28%. If, however, an investor was fully invested through the ups and downs, the return would have been 17,715%. That’s not a typo.

What Should You Do?
When stock markets plunge, as they did back in March of 2020, it is natural for investors to panic-sell. The opposite is also true: when stock markets reach new highs, it is natural for investors to panic-buy.
Both panic-selling and panic-buying can significantly lower returns for longer-term investors by causing them to miss the best days or invest during the worst days.
A better approach might be to simply remain committed to your long-term financial plan. And stay invested. Your financial professional can help you do both.
Have specific questions? Don't hesitate to reach out to me today
Wes Garner, CRPC
Principal Wealth Strategist
(281) 269-8669
wgarner@tdecu.org

Important Disclosures
All information is believed to be from reliable sources; however LPL Financial makes no representation as to its completeness or accuracy.
Investing in stock includes numerous specific risks including: the fluctuation of dividend, loss of principal and potential illiquidity of the investment in a falling market.
Dow Jones Industrial Average (DJIA): A price-weighted average of 30 blue-chip stocks that are generally the leaders in their industry.
S&P 500 Index: The Standard & Poor's (S&P) 500 Index tracks the performance of 500 widely held, large-capitalization US stocks.
The NASDAQ-100 is composed of the 100 largest domestic and international non-financial securities listed on The Nasdaq Stock Market. The Index reflects companies across major industry groups including computer hardware and software, telecommunications, retail/wholesale trade and biotechnology, but does not contain securities of financial companies.
The Russell 2000 Index is an unmanaged index generally representative of the 2,000 smallest companies in the Russell Index, which represents approximately 10% of the total market capitalization of the Russell 3000 Index.
This article was prepared by FMeX.
LPL Tracking # 1-05127229
