2020 was a year characterized in part by the outbreak of a global pandemic, which captivated the world and shocked the global economy and financial markets. As we turn the page to 2021, it can be helpful to reflect on the lessons learned from such a historic year. We offer 10 economic lessons we’ll remember from 2020.
A Year to Remember
To say that 2020 was a unique year would be an understatement. What began as an ordinary year quickly turned into an extraordinary one—does anyone even remember it was a leap year? Initial reports in early January noted that a novel virus was beginning to spread, but few at the time could comprehend how the situation would escalate. By March, the COVID-19 pandemic gripped the entire world. So after such a tumultuous year, what have we learned?
10 Takeaways From 2020
The world is full of surprises. When we published our Outlook 2020 in December 2019, we did not forecast a recession in the United States. Heading into 2020, the economy was growing modestly—we didn’t see the usual extremes like excessive spending or overleverage that have been the hallmarks of the end of past economic cycles. The outbreak of COVID-19 forced the economy to slam on the brakes as much of the world went into lockdown to contain the spread, ending the longest economic expansion ever—one that had lasted more than 10 years.
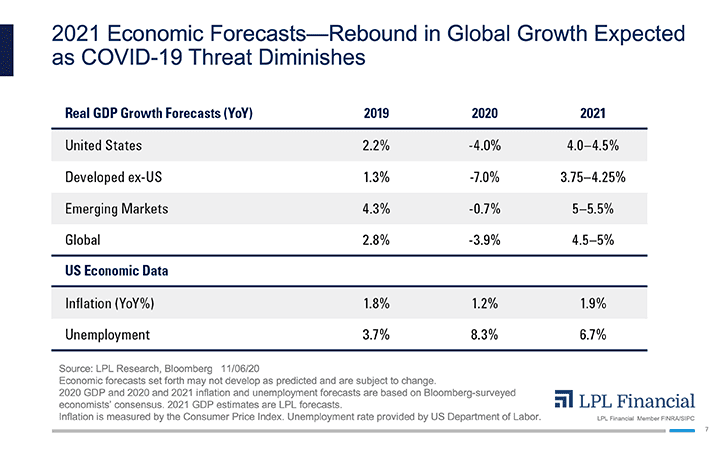
Records are meant to be broken. As the imposition of stay-at-home orders kept the US consumer from spending, gross domestic product (GDP) declined a record 31% in the second quarter and unemployment skyrocketed to a post-WWII record 14.7%. When the US economy began to recover from the lockdowns, GDP rebounded 33% in the third quarter, also a record. This set the stage for what potentially could be the shortest recession on record—to be determined when the end of the recession is officially marked by the National Bureau of Economic Research. As we discussed in this year’s Outlook 2021: Powering Forward, we now expect US GDP growth of 4–4.5% in 2021 [FIGURE 1].

Stimulus matters. A historic recession required a historic policy response. Many speculated that the Federal Reserve (Fed) was out of ammunition, but policymakers proved doubters wrong. The Fed effectively lowered interest rates to zero, expanded its balance sheet by record amounts (15% of US GDP), and even ventured into purchasing corporate bonds—both investment grade and high yield—to restore function to markets and support corporate borrowing. Meanwhile, Congress passed record amounts of fiscal stimulus (totaling roughly 10% of US GDP in 2020), including small business lending and direct payments to households, to help lift the economy as it emerged from lockdowns.
The path of returns typically isn’t a straight line. Ideally, the low-volatility/high-return environment of 2017 would have been the norm at this point of an economic cycle, but unfortunately it wasn’t. 2020 brought us the fastest bear market in history (down 20% from the highs), with the S&P 500 Index reaching that level in just 16 trading days on its way to a peak drawdown of roughly 34%. Supported by historic stimulus measures, stocks rebounded off the lows to climb back to new all-time highs in only 106 trading days. 2020 also was the only year when stocks experienced a 30% drawdown and managed to finish the year in positive territory.
Markets can experience extraordinary short-term disruptions. At the height of the March volatility, we saw multiple Sundays when S&P 500 futures traded limit-down—when circuit-breaker mechanisms kicked in to prevent further losses. Then during regular trading sessions, stocks experienced trading halts triggered by large intraday losses. While the orderly operation of stock markets had returned by April, oil futures were not out of the woods. Global lockdowns caused energy demand to plummet and maxed out the capacity of supply tankers, sending the price of the April WTI crude oil contract into negative territory—implying someone literally would pay you to take delivery of their oil.
Stock markets are forward looking. In late March, we upgraded our recommendation on equities to overweight. Though we admitted the timing of the recovery from the bear market was uncertain, we believed at that time that stocks would soon begin to price in the end of the pandemic, bolstered by the massive stimulus response. With the economy at a standstill, 2020 earnings forecasts plunged more than 25% (source: FactSet). Consensus earnings per share (EPS) estimates for the S&P 500 bottomed in late June, after the index had already rebounded 35% from the March 23 low. Stocks were well ahead of the economy and analysts’ earnings forecasts.
Lower for longer. In 2020 the 10-year US Treasury yield plummeted to its lowest in history. We expect the 10-year Treasury yield will rise to a target range of 1.25–1.75% by year-end 2021 as the economy expands and inflation normalizes, but lower interest rates may be here to stay. The economic turmoil has prompted the Fed to lower interest rates and convey the intention to keep them low for an extended period of time. Few on Wall Street expect the Fed to raise interest rates before 2023, and only one member of the Fed expects a rate hike before then, according to the most recent dot-plot survey of Fed members’ policy rate projections.
Stocks like election clarity. We have stressed the importance of not trying to time investment decisions based on political preferences, as we believe that stocks mainly want clarity from elections. Stocks put together another strong rally when more clarity arrived after the 2020 presidential election. They also benefited from the anticipation of a Congress likely split between Democrats and Republicans, an environment where stocks historically have delivered their strongest returns since 1950.
The wonders of modern medicine. The Food and Drug Administration so far has granted emergency use authorization to two COVID-19 vaccines, and the first doses have been administered. While there is considerable uncertainty about the mass production and distribution of the vaccines, it is a remarkable feat of modern scientific medicine nonetheless. As the vaccine is distributed, we expect the hard-hit areas of the economy—particularly service industries—will begin to improve as life slowly begins to normalize.
The power of human perseverance. Many sacrifices have been made in 2020, from holding off on visiting loved ones to helping children with virtual education, and the fight against COVID-19 is not quite over despite the discovery of new vaccines. Humanity has an incredible ability to find solutions to its problems, and 2020 showed our ability to persevere as a society.
LPL Research's Outlook for 2021
The beauty of investing is there is always something to learn, and only time can provide experience—although 2020 certainly was enough experience for a lifetime. We are hoping 2021 provides another strong year of returns like 2020, though we also hope the path to get there will be smoother. More insights on our views for the New Year can be found in Outlook 2021: Powering Forward. We wish you and your family a safe and wonderful New Year!
Read previous editions of Weekly Market Commentary on lpl.com at News & Media.
Ryan Detrick, CMT, Chief Market Strategist, LPL Financial
Nick Pergakis, Analyst, LPL Financial
______________________________________________________________________________________________
IMPORTANT DISCLOSURES
This material is for general information only and is not intended to provide specific advice or recommendations for any individual. There is no assurance that the views or strategies discussed are suitable for all investors or will yield positive outcomes. Investing involves risks including possible loss of principal. Any economic forecasts set forth may not develop as predicted and are subject to change.
References to markets, asset classes, and sectors are generally regarding the corresponding market index. Indexes are unmanaged statistical composites and cannot be invested into directly. Index performance is not indicative of the performance of any investment and do not reflect fees, expenses, or sales charges. All performance referenced is historical and is no guarantee of future results.
Any company names noted herein are for educational purposes only and not an indication of trading intent or a solicitation of their products or services. LPL Financial doesn’t provide research on individual equities.
All information is believed to be from reliable sources; however, LPL Financial makes no representation as to its completeness or accuracy.
US Treasuries may be considered “safe haven” investments but do carry some degree of risk including interest rate, credit, and market risk. Bonds are subject to market and interest rate risk if sold prior to maturity. Bond values will decline as interest rates rise and bonds are subject to availability and change in price.
The Standard & Poor’s 500 Index (S&P500) is a capitalization-weighted index of 500 stocks designed to measure performance of the broad domestic economy through changes in the aggregate market value of 500 stocks representing all major industries.
The PE ratio (price-to-earnings ratio) is a measure of the price paid for a share relative to the annual net income or profit earned by the firm per share. It is a financial ratio used for valuation: a higher PE ratio means that investors are paying more for each unit of net income, so the stock is more expensive compared to one with lower PE ratio.
Earnings per share (EPS) is the portion of a company’s profit allocated to each outstanding share of common stock. EPS serves as an indicator of a company’s profitability. Earnings per share is generally considered to be the single most important variable in determining a share’s price. It is also a major component used to calculate the price-to-earnings valuation ratio.
All index data from FactSet.
Please read the full Outlook 2021: Powering Forward publication for additional description and disclosure.
This research material has been prepared by LPL Financial LLC.
Securities and advisory services offered through LPL Financial (LPL), a registered investment advisor and broker-dealer (member FINRA/SIPC). Insurance products are offered through LPL or its licensed affiliates. To the extent you are receiving investment advice from a separately registered independent investment advisor that is not an LPL affiliate, please note LPL makes no representation with respect to such entity.
| Not Insured by FDIC/NCUA or Any Other Government Agency | Not Bank/Credit Union Guaranteed | Not Bank/Credit Union Deposits or Obligations | May Lose Value |
RES-45807-1220 | For Public Use | Tracking # 1-05092965 (Exp. 01/22)
